 ## Step 5: Add User Inputs
Hardcoding values isn't very flexible. Instead, let's allow users to set the periods via inputs using the [`input()`](/kscript/functions/script-definition#input) function. This makes your indicator customizable.
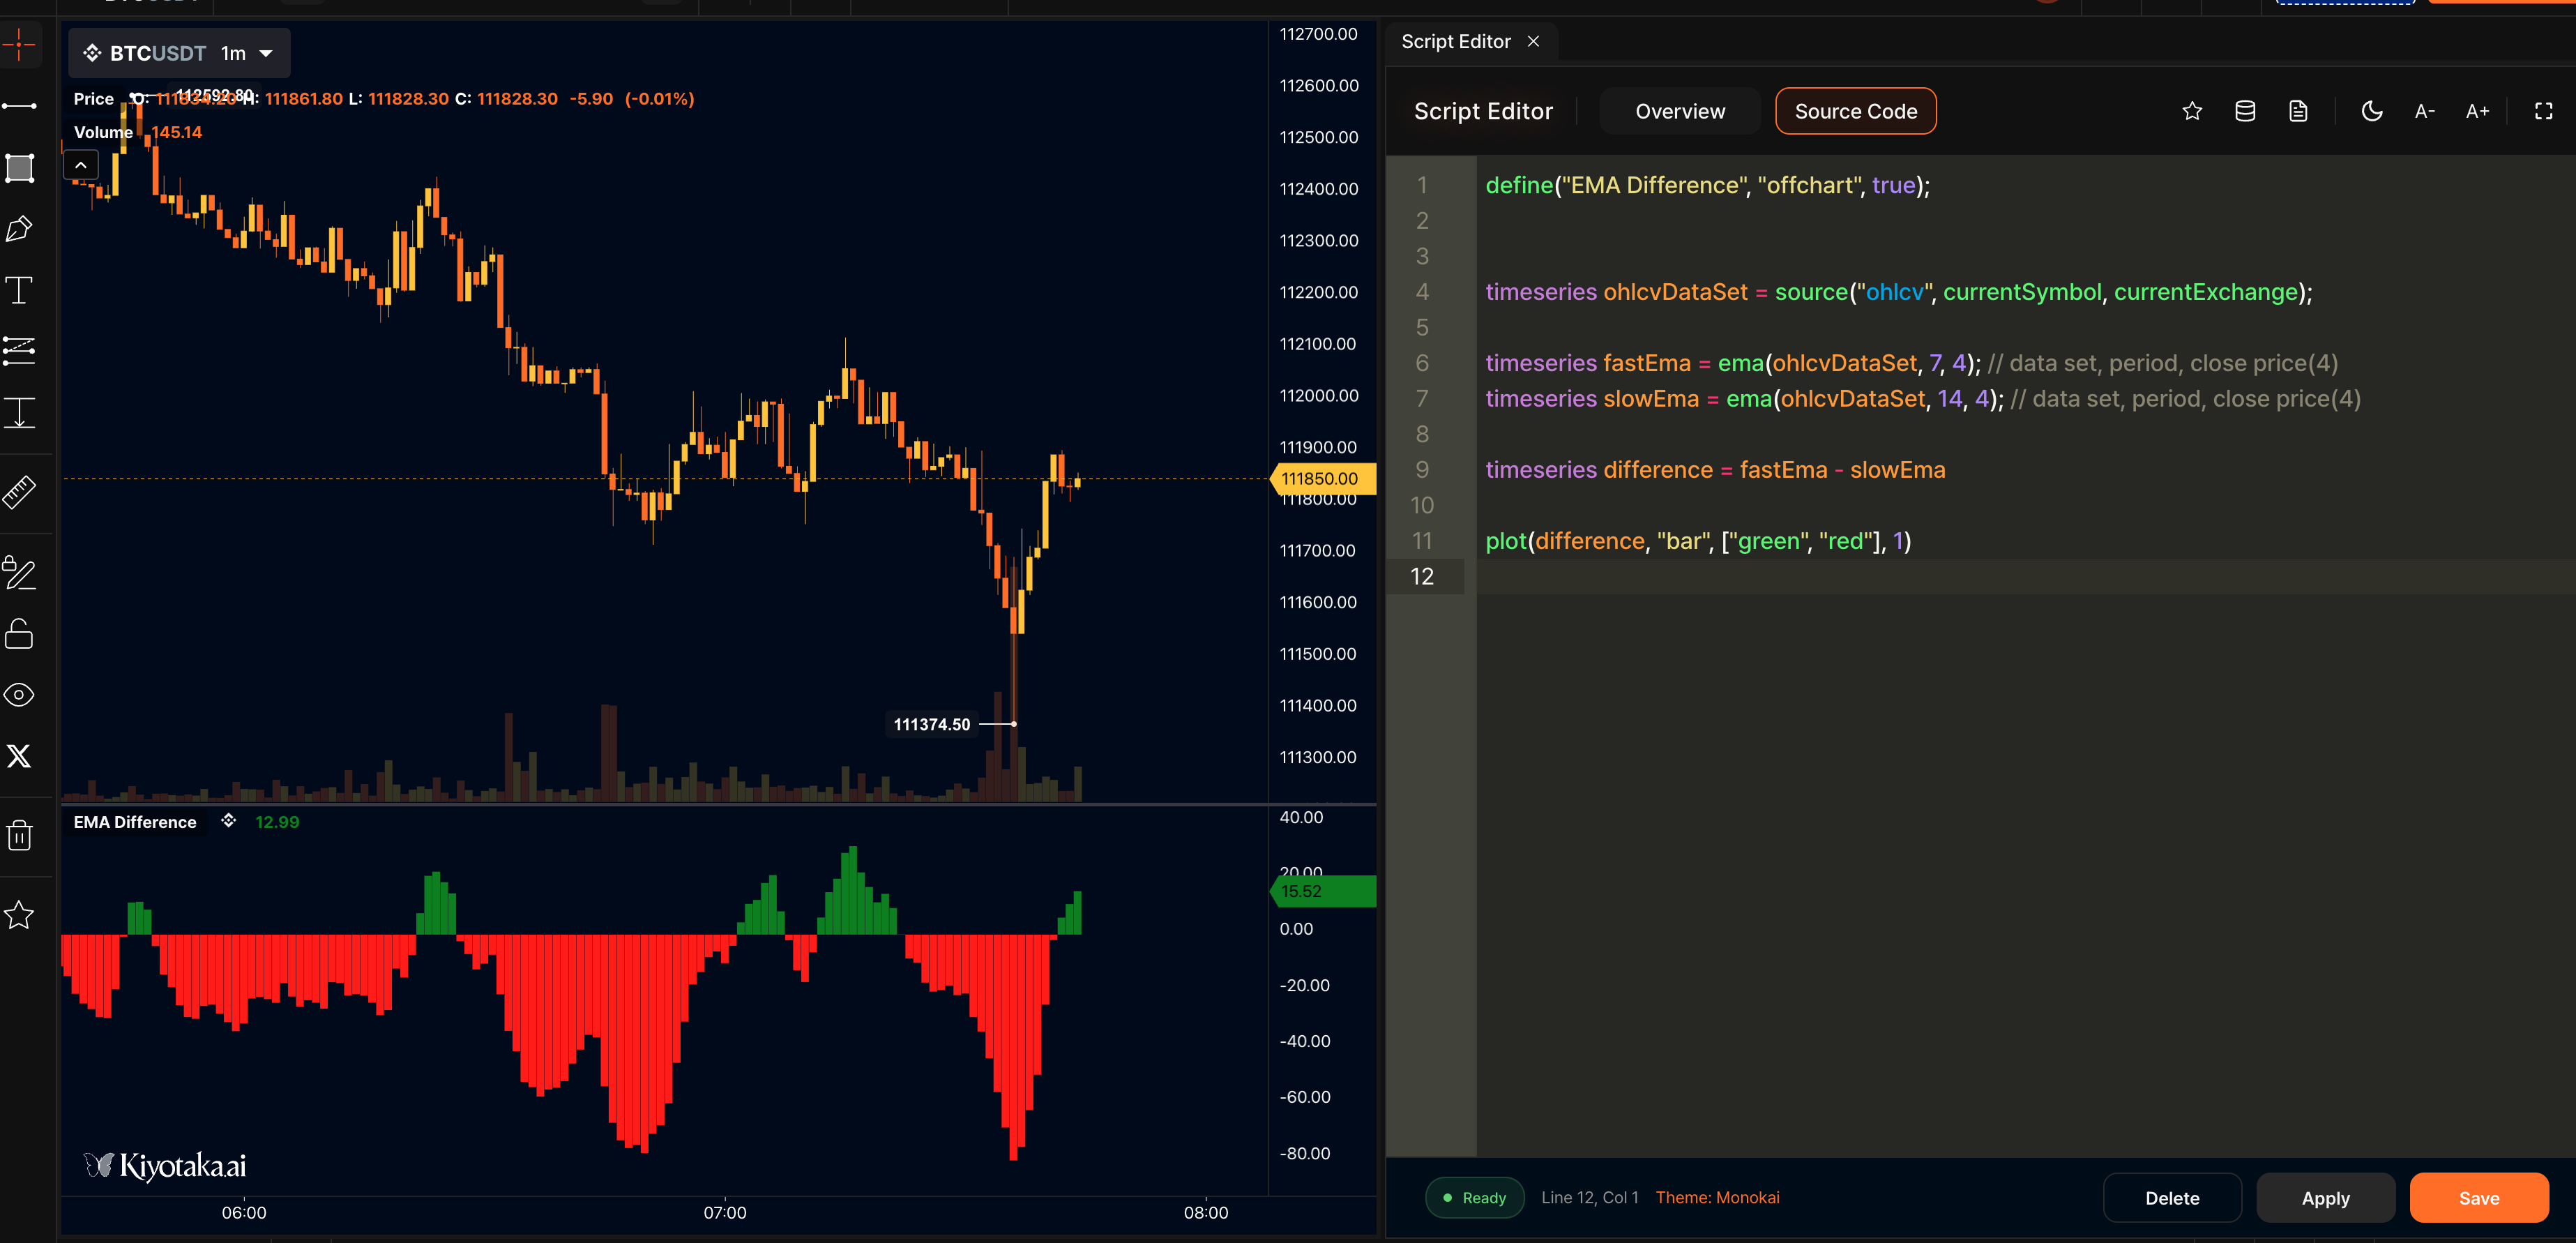
```javascript title="Step 5: Add User Inputs" lines wrap
//@version=2
// definition
define(title="EMA Difference", position="offchart", axis=true, customTitle="($fastPeriod, $slowPeriod)");
var fastPeriod = input(name="fastPeriod", type="number", defaultValue=7, label="Fast Period");
var slowPeriod = input(name="slowPeriod", type="number", defaultValue=14, label="Slow Period");
// logic
timeseries ohlcvDataSet = ohlcv(symbol=currentSymbol, exchange=currentExchange);
var fastEma = ema(source=ohlcvDataSet.close, period=fastPeriod);
var slowEma = ema(source=ohlcvDataSet.close, period=slowPeriod);
var difference = fastEma - slowEma;
var colorIndex = difference > 0 ? 0 : 1;
// plot
plotBar(value=difference, width=1, colors=["green", "red"], colorIndex=colorIndex, label=["EMA Difference"], desc=["Fast EMA - Slow EMA"]);
```
**Input parameters:**
- `fastPeriod` - Key for the input (used in code)
- `"number"` - Input type (number)
- `7` - Default value
- `"Fast Period"` - Label shown to users
{% hint style="info" %}
We use `var` instead of `timeseries` because user inputs are scalar values, not time series.
{% endhint %}
{% hint style="success" %}
If you want to include the user settings in the indicator title, you can change the definition like this:
`define(title="EMA Difference", position="offchart", axis=true, customTitle="($fastPeriod, $slowPeriod)");`
The title will then read as "EMA Difference (7, 14)".
{% endhint %}
## Final Script
Here's your complete EMA Difference indicator script:
```javascript title="Complete EMA Difference Indicator Script" lines wrap
//@version=2
// definition
define(title="EMA Difference", position="offchart", axis=true, customTitle="($fastPeriod, $slowPeriod)");
var fastPeriod = input(name="fastPeriod", type="number", defaultValue=7, label="Fast Period");
var slowPeriod = input(name="slowPeriod", type="number", defaultValue=14, label="Slow Period");
// logic
timeseries ohlcvDataSet = ohlcv(symbol=currentSymbol, exchange=currentExchange);
var fastEma = ema(source=ohlcvDataSet.close, period=fastPeriod);
var slowEma = ema(source=ohlcvDataSet.close, period=slowPeriod);
var difference = fastEma - slowEma;
var colorIndex = difference > 0 ? 0 : 1;
// plot
plotBar(value=difference, width=1, colors=["green", "red"], colorIndex=colorIndex, label=["EMA Difference"], desc=["Fast EMA - Slow EMA"]);
```
{% hint style="info" %}
**Congratulations!** You've built your first kScript indicator. Try experimenting with different functions, plots, and inputs next.
{% endhint %}
## What's Next?
## Step 5: Add User Inputs
Hardcoding values isn't very flexible. Instead, let's allow users to set the periods via inputs using the [`input()`](/kscript/functions/script-definition#input) function. This makes your indicator customizable.
```javascript title="Step 5: Add User Inputs" lines wrap
//@version=2
// definition
define(title="EMA Difference", position="offchart", axis=true, customTitle="($fastPeriod, $slowPeriod)");
var fastPeriod = input(name="fastPeriod", type="number", defaultValue=7, label="Fast Period");
var slowPeriod = input(name="slowPeriod", type="number", defaultValue=14, label="Slow Period");
// logic
timeseries ohlcvDataSet = ohlcv(symbol=currentSymbol, exchange=currentExchange);
var fastEma = ema(source=ohlcvDataSet.close, period=fastPeriod);
var slowEma = ema(source=ohlcvDataSet.close, period=slowPeriod);
var difference = fastEma - slowEma;
var colorIndex = difference > 0 ? 0 : 1;
// plot
plotBar(value=difference, width=1, colors=["green", "red"], colorIndex=colorIndex, label=["EMA Difference"], desc=["Fast EMA - Slow EMA"]);
```
**Input parameters:**
- `fastPeriod` - Key for the input (used in code)
- `"number"` - Input type (number)
- `7` - Default value
- `"Fast Period"` - Label shown to users
{% hint style="info" %}
We use `var` instead of `timeseries` because user inputs are scalar values, not time series.
{% endhint %}
{% hint style="success" %}
If you want to include the user settings in the indicator title, you can change the definition like this:
`define(title="EMA Difference", position="offchart", axis=true, customTitle="($fastPeriod, $slowPeriod)");`
The title will then read as "EMA Difference (7, 14)".
{% endhint %}
## Final Script
Here's your complete EMA Difference indicator script:
```javascript title="Complete EMA Difference Indicator Script" lines wrap
//@version=2
// definition
define(title="EMA Difference", position="offchart", axis=true, customTitle="($fastPeriod, $slowPeriod)");
var fastPeriod = input(name="fastPeriod", type="number", defaultValue=7, label="Fast Period");
var slowPeriod = input(name="slowPeriod", type="number", defaultValue=14, label="Slow Period");
// logic
timeseries ohlcvDataSet = ohlcv(symbol=currentSymbol, exchange=currentExchange);
var fastEma = ema(source=ohlcvDataSet.close, period=fastPeriod);
var slowEma = ema(source=ohlcvDataSet.close, period=slowPeriod);
var difference = fastEma - slowEma;
var colorIndex = difference > 0 ? 0 : 1;
// plot
plotBar(value=difference, width=1, colors=["green", "red"], colorIndex=colorIndex, label=["EMA Difference"], desc=["Fast EMA - Slow EMA"]);
```
{% hint style="info" %}
**Congratulations!** You've built your first kScript indicator. Try experimenting with different functions, plots, and inputs next.
{% endhint %}
## What's Next?