This guide walks you through creating your very first indicator in kScript. We'll build an off-chart indicator that plots the difference between two EMAs as bars.
Anatomy of a kScript
Every kScript has three main parts:
- 1
Definition
Define the name, title, and placement of your indicator
- 2
Logic
Calculate the data that will be plotted
- 3
Plot
Visualize the data
Step 1: Basic Script Structure
We'll build an off-chart indicator that plots the difference between two EMAs as bars. Every kScript v2 starts with a compiler annotation //@version=2 followed by a define() function that tells the platform what your script does and where to display it.
//@version=2

// definition
define(title="EMA Difference", position="offchart", axis=true, customTitle="($fastPeriod, $slowPeriod)");

// logic

// plot
Explanation:
//@version=2- Required compiler annotation that tells kScript to use version 2 syntax and features"EMA Difference"- The display name in the UI"offchart"- Shows the indicator in a separate panel below the main charttrue- Creates an independent Y-axis for better scaling"($fastPeriod, $slowPeriod)"- Adds input values to the title, so it displays as "EMA Difference (7, 14)"
Step 2: Get the Data
To plot anything, we first need data. In kScript, that starts with subscribing to a data source. The ohlcv() function gives us OHLCV (trade data). For this example, we'll focus on close prices.
//@version=2

// definition
define(title="EMA Difference", position="offchart", axis=true, customTitle="($fastPeriod, $slowPeriod)");

// logic
timeseries ohlcvDataSet = ohlcv(symbol=currentSymbol, exchange=currentExchange);

// plot
Data source explained:
timeseries- A special type for time-series data. All other types can be declared usingvarohlcv(...)- Gets OHLCV data of the current chartcurrentSymbol- Uses the currently selected trading paircurrentExchange- Uses the currently selected exchange
Step 3: Build the Logic
Now let's calculate our EMAs. The standard library includes an ema() function. We'll calculate a fast EMA (7 periods) and slow EMA (14 periods), then find their difference.
//@version=2

// definition
define(title="EMA Difference", position="offchart", axis=true, customTitle="($fastPeriod, $slowPeriod)");

// logic
timeseries ohlcvDataSet = ohlcv(symbol=currentSymbol, exchange=currentExchange);

var fastEma = ema(source=ohlcvDataSet, period=7, priceIndex=4); // dataset, period, close column (4)
var slowEma = ema(source=ohlcvDataSet, period=14, priceIndex=4); // dataset, period, close column (4)

// Alternatively, you can use the .close property for cleaner syntax
// var fastEma = ema(source=ohlcvDataSet.close, period=7);
// var slowEma = ema(source=ohlcvDataSet.close, period=14);

var difference = fastEma - slowEma;

// plot
EMA calculations:
ema(ohlcvDataSet, 7, 4)- Fast EMA with 7 periods using close price (column 4)ema(ohlcvDataSet, 14, 4)- Slow EMA with 14 periods using close price (column 4)fastEma - slowEma- Calculate the difference between the two EMAs
Step 4: Plot the Data
Now let's plot the difference as bars using the plotBar() function. We'll use green bars for positive values and red bars for negative values.
//@version=2

// definition
define(title="EMA Difference", position="offchart", axis=true, customTitle="($fastPeriod, $slowPeriod)");

// logic
timeseries ohlcvDataSet = ohlcv(symbol=currentSymbol, exchange=currentExchange);

var fastEma = ema(source=ohlcvDataSet.close, period=7); // dataset, period, close column
var slowEma = ema(source=ohlcvDataSet.close, period=14); // dataset, period, close column

var difference = fastEma - slowEma;

var colorIndex = difference > 0 ? 0 : 1;

// plot
plotBar(value=difference, width=1, colors=["green", "red"], colorIndex=colorIndex, label=["EMA Difference"], desc=["Fast EMA - Slow EMA"]);
plotBar parameters:
-
difference- The EMA difference data series to plot as bars -
["green", "red"]- Color array for positive/negative bars -
colorIndex- Index to select specific color from colors array (0 for green, 1 for red) -
1- Bar width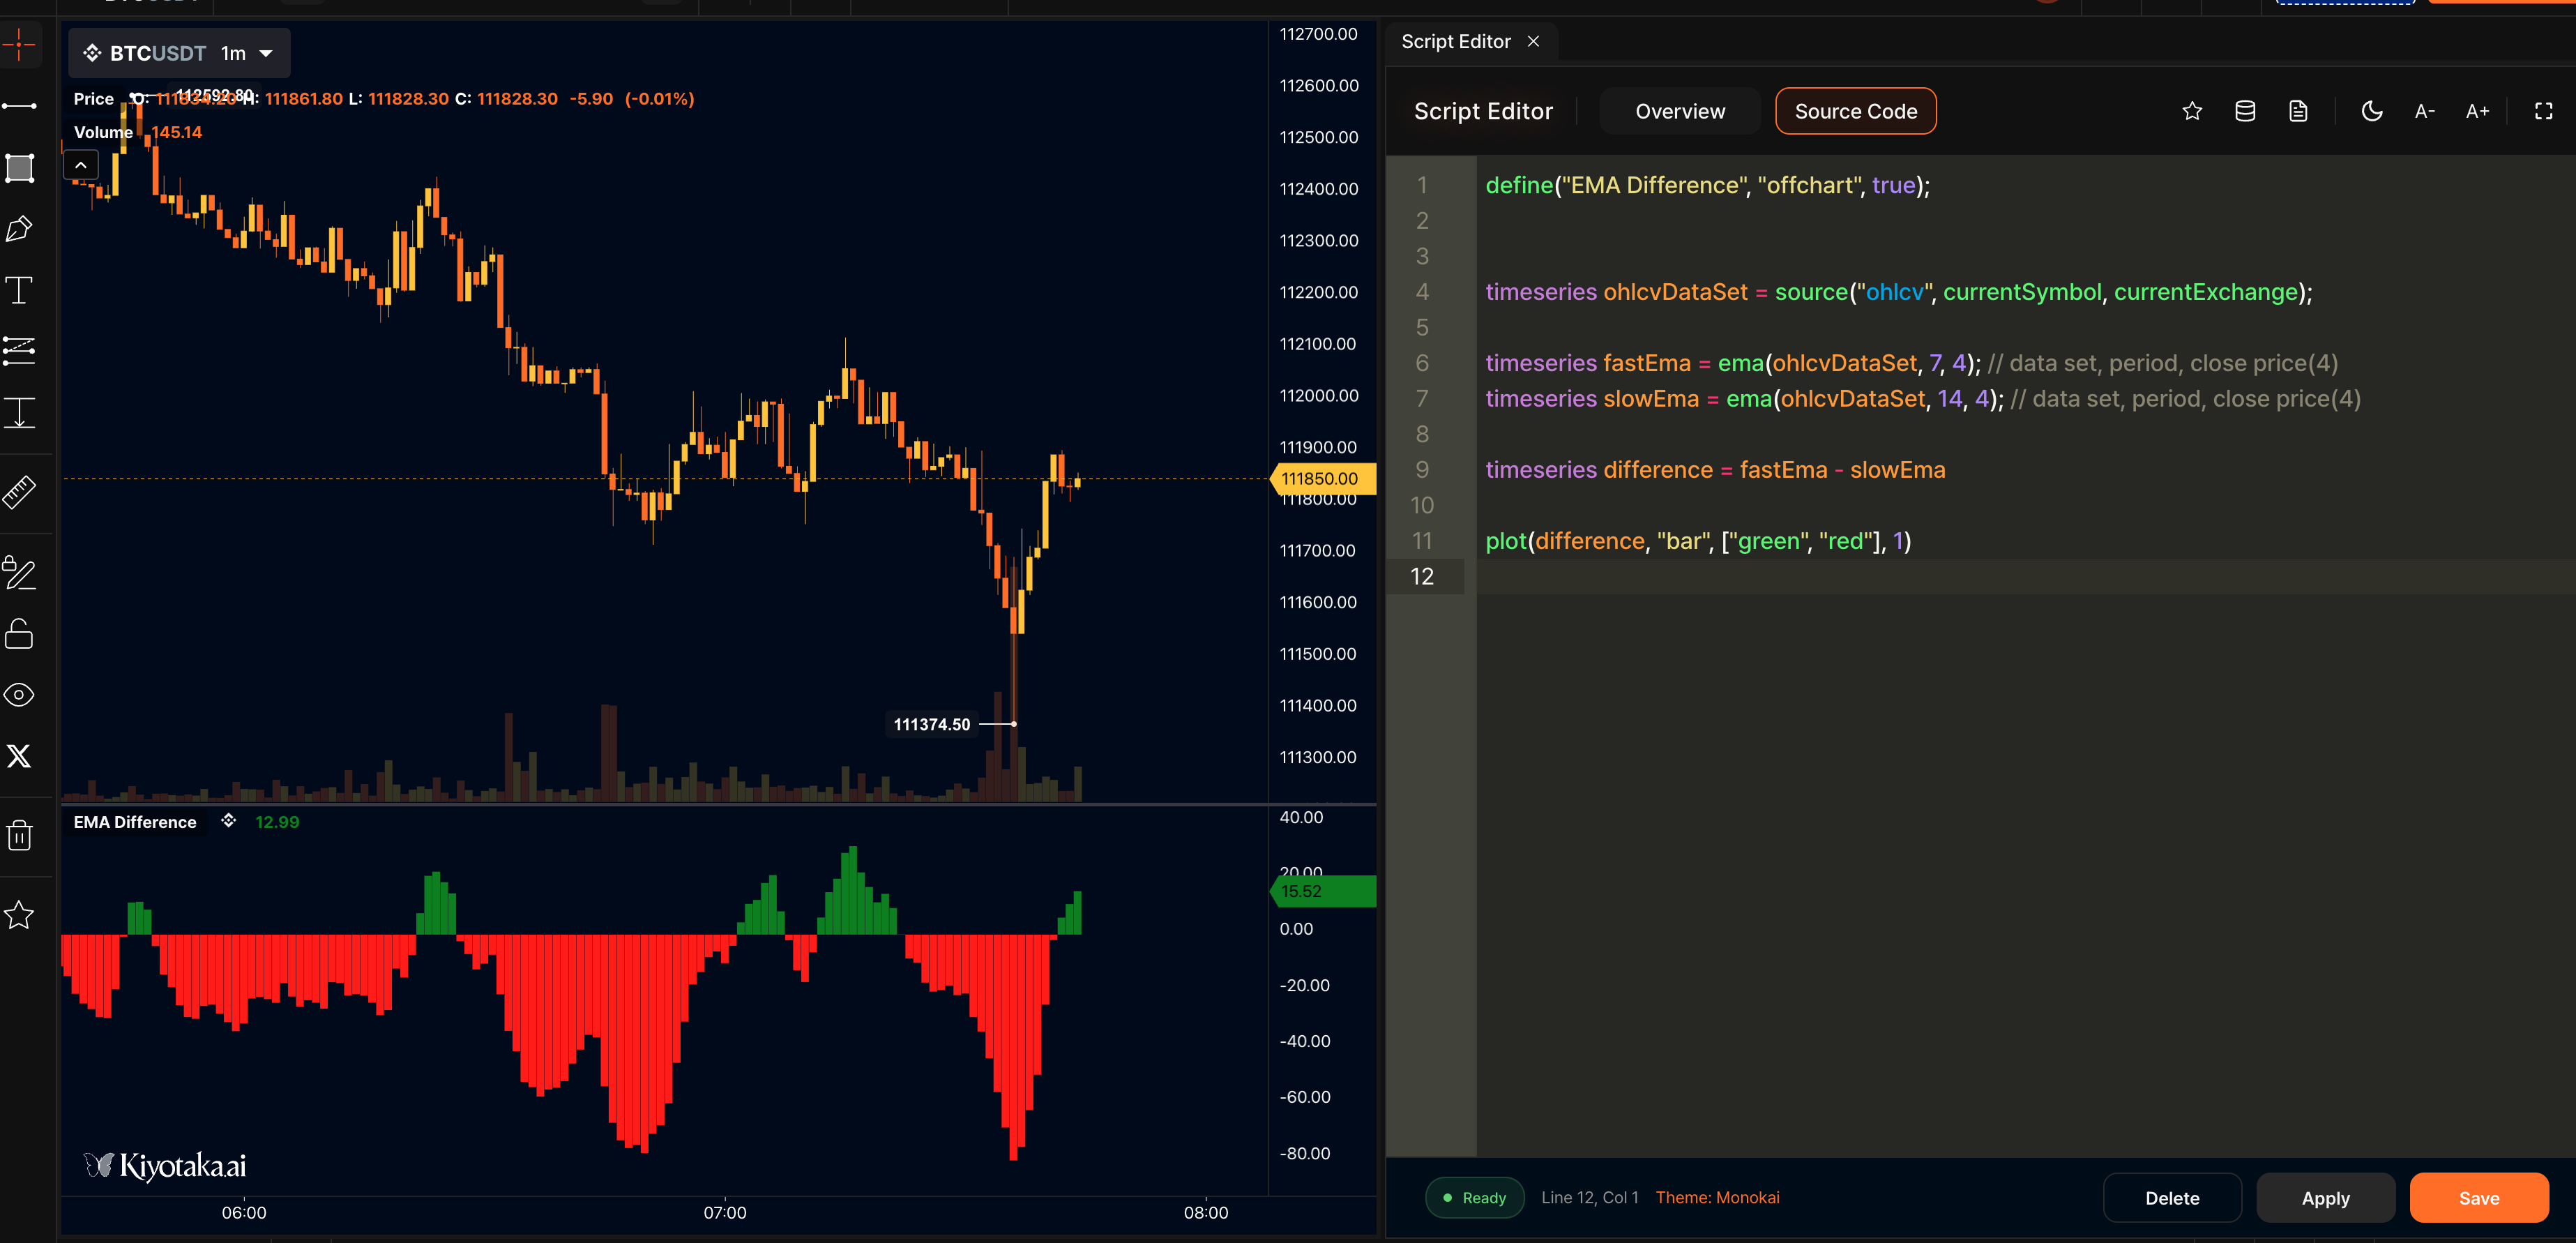
Step 5: Add User Inputs
Hardcoding values isn't very flexible. Instead, let's allow users to set the periods via inputs using the input() function. This makes your indicator customizable.
//@version=2

// definition
define(title="EMA Difference", position="offchart", axis=true, customTitle="($fastPeriod, $slowPeriod)");

var fastPeriod = input(name="fastPeriod", type="number", defaultValue=7, label="Fast Period");
var slowPeriod = input(name="slowPeriod", type="number", defaultValue=14, label="Slow Period");

// logic
timeseries ohlcvDataSet = ohlcv(symbol=currentSymbol, exchange=currentExchange);

var fastEma = ema(source=ohlcvDataSet.close, period=fastPeriod);
var slowEma = ema(source=ohlcvDataSet.close, period=slowPeriod);

var difference = fastEma - slowEma;

var colorIndex = difference > 0 ? 0 : 1;

// plot
plotBar(value=difference, width=1, colors=["green", "red"], colorIndex=colorIndex, label=["EMA Difference"], desc=["Fast EMA - Slow EMA"]);
Input parameters:
fastPeriod- Key for the input (used in code)"number"- Input type (number)7- Default value"Fast Period"- Label shown to users
Final Script
Here's your complete EMA Difference indicator script:
//@version=2

// definition
define(title="EMA Difference", position="offchart", axis=true, customTitle="($fastPeriod, $slowPeriod)");

var fastPeriod = input(name="fastPeriod", type="number", defaultValue=7, label="Fast Period");
var slowPeriod = input(name="slowPeriod", type="number", defaultValue=14, label="Slow Period");

// logic
timeseries ohlcvDataSet = ohlcv(symbol=currentSymbol, exchange=currentExchange);

var fastEma = ema(source=ohlcvDataSet.close, period=fastPeriod);
var slowEma = ema(source=ohlcvDataSet.close, period=slowPeriod);

var difference = fastEma - slowEma;

var colorIndex = difference > 0 ? 0 : 1;

// plot
plotBar(value=difference, width=1, colors=["green", "red"], colorIndex=colorIndex, label=["EMA Difference"], desc=["Fast EMA - Slow EMA"]);