Plotting & Visualization
Functions for rendering data on charts with customizable styling, colors, and visual effects. Create beautiful and informative visualizations for your technical indicators and market analysis.
Overview
Chart Rendering
Plot time series data directly onto charts with multiple style options including lines, splines, points, candles, and bars for comprehensive market visualization.
Visual Customization
Customize colors, line widths, fill areas, and smoothing options to create visually appealing and distinct indicators that stand out on your charts.
Advanced Effects
Apply advanced visual effects like momentum fills, smooth curves, and multi-layer plotting to create sophisticated technical analysis displays.
Functions Reference
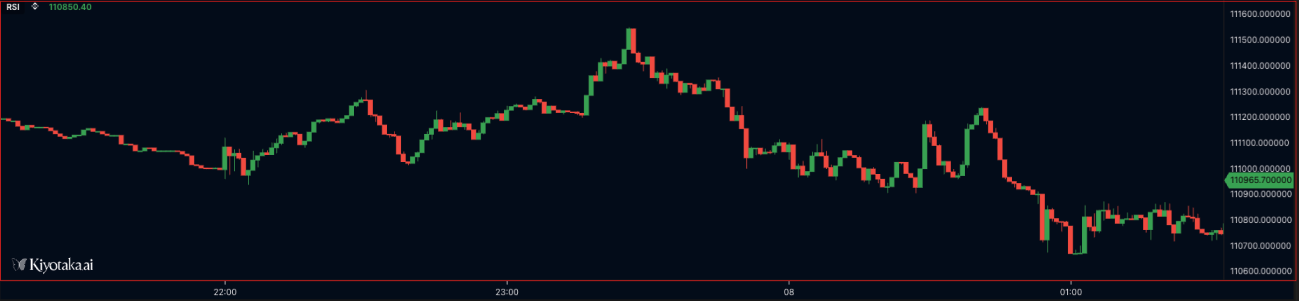
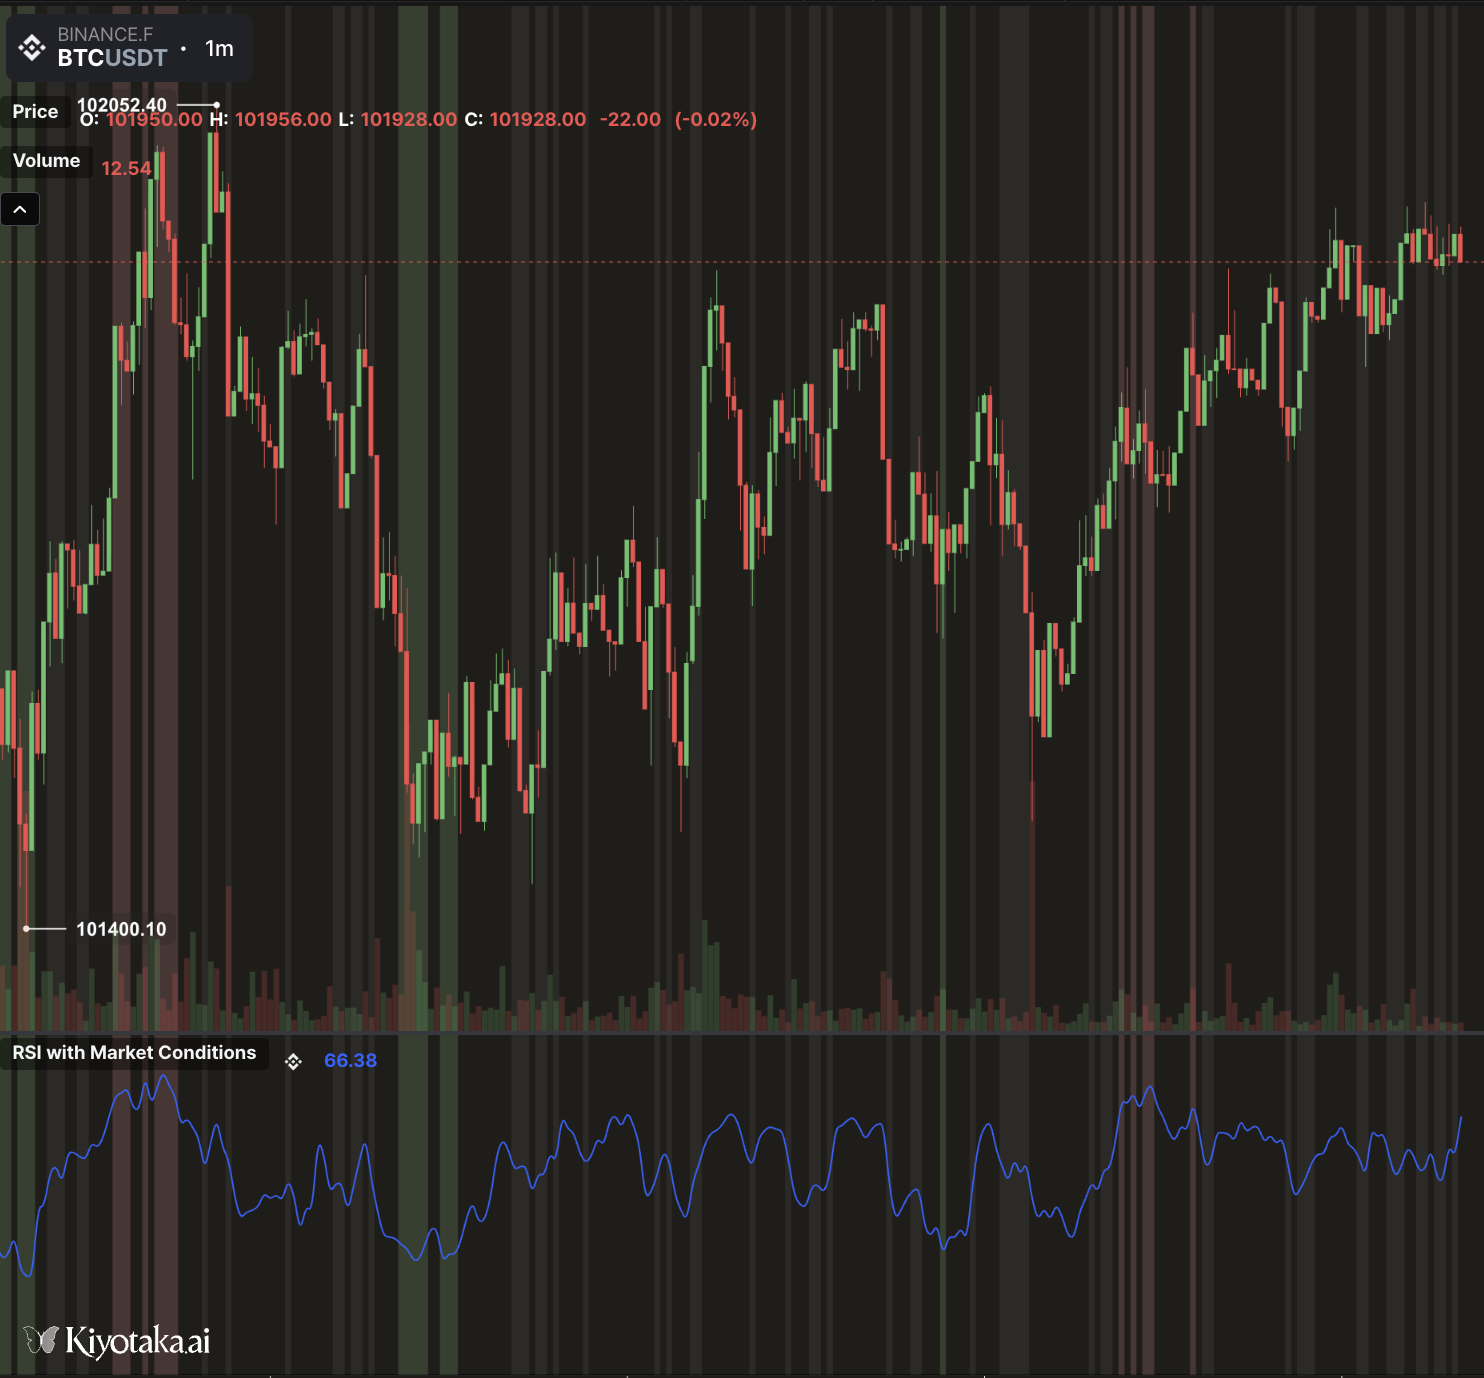
plotCandle - render OHLC data as candlestick charts
plotCandle(value: TimeSeries, width?: number = 1, colors?: color[], colorIndex?: number, showPriceDisplay?: boolean = true, forceOnChart?: boolean = false, label?: string[], desc?: string[]): voidParameters:
- value (TimeSeries) - OHLC data series to plot as candlesticks (requires 4 values: Open, High, Low, Close)
- width (number) - Candle width (default: 1)
- colors (color[]) - Color array for bullish/bearish candles (theme-dependent)
- colorIndex (number) - Index to select specific color from colors array (optional)
- showPriceDisplay (boolean) - Show current value in price scale (default: true)
- forceOnChart (boolean) - Force plot to appear on the main chart regardless of script position setting (default: false)
- label (string[]) - Labels for each data series. A label must be provided for each plot as required by the script editor.
- desc (string[]) - Descriptions for each data series. Optional but recommended - missing descriptions will generate warnings but will not prevent execution.
Returns:
void (plots candlestick chart)
Visual Example:
Code Example:
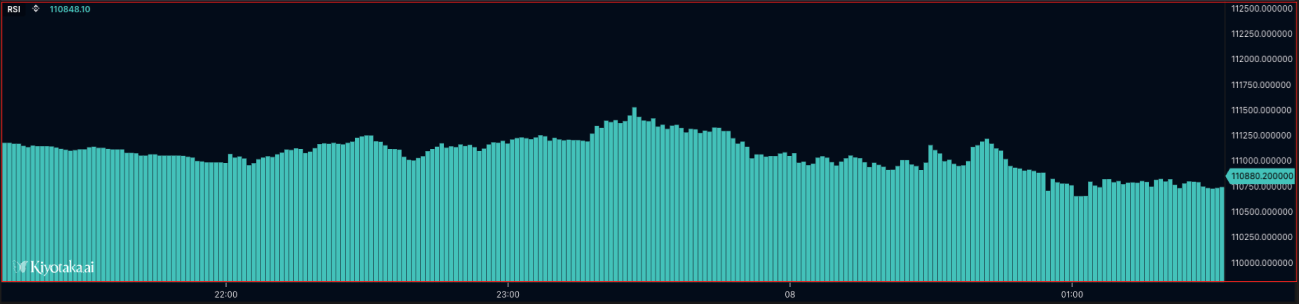
plotBar - render data as traditional bar charts
plotBar(value: TimeSeries, width?: number = 1, colors?: color[], colorIndex?: number, showPriceDisplay?: boolean = true, forceOnChart?: boolean = false, gradingMode?: "linear" | "square", label?: string[], desc?: string[]): voidParameters:
- value (TimeSeries) - Data series to plot as bars (uses first value if multi-value series)
- width (number) - Bar width (default: 1)
- colors (color[]) - Color array for bullish/bearish bars (theme-dependent)
- colorIndex (number) - Index to select specific color from colors array (optional)
- showPriceDisplay (boolean) - Show current value in price scale (default: true)
- forceOnChart (boolean) - Force plot to appear on the main chart regardless of script position setting (default: false)
- gradingMode ("linear" | "square") - Color grading mode for bar visualization. "linear" applies colors uniformly across the value range, while "square" emphasizes extreme values by squaring the normalized ratio. Use "square" to make high/low values more visually distinct. (default: "linear")
- label (string[]) - Labels for each data series. A label must be provided for each plot as required by the script editor.
- desc (string[]) - Descriptions for each data series. Optional but recommended - missing descriptions will generate warnings but will not prevent execution.
Returns:
void (plots bar chart)
Visual Example:
Code Example:
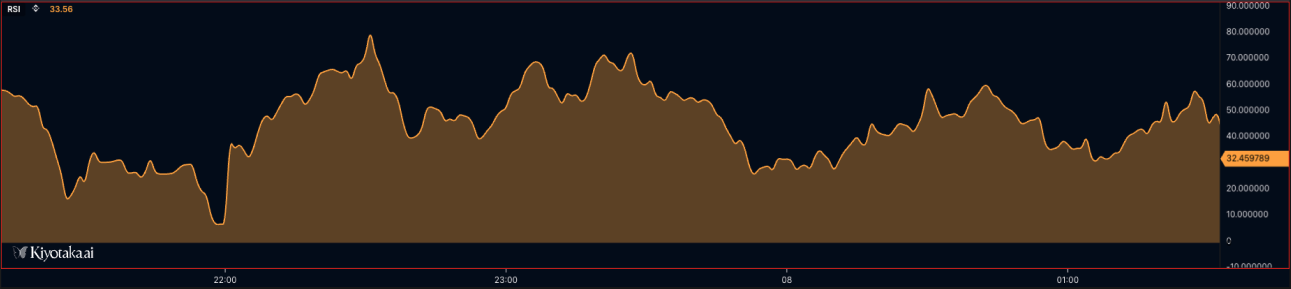
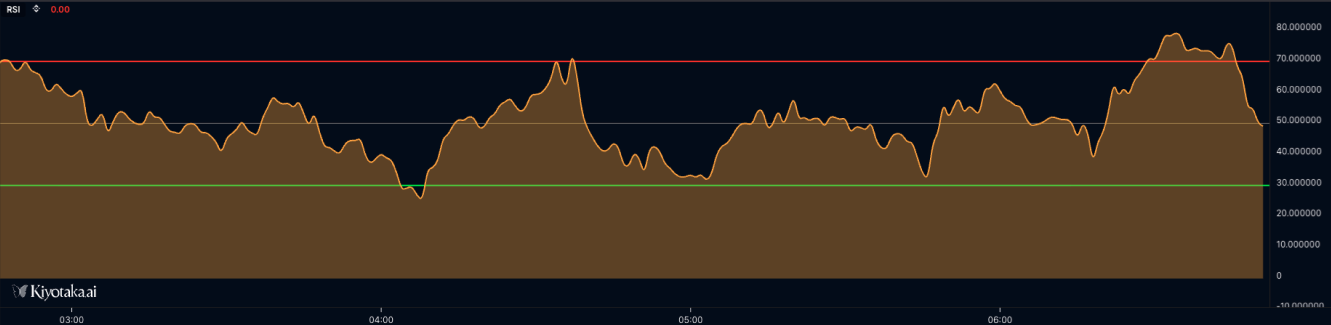
plotLine - render data as enhanced line charts
plotLine(value: TimeSeries, width?: number = 1, colors?: color[], colorIndex?: number, fill?: boolean | 'momentum_fill' | 'default' = false, smooth?: boolean = true, showPriceDisplay?: boolean = false, forceOnChart?: boolean = false, label?: string[], desc?: string[]): voidParameters:
- value (TimeSeries) - Data series to plot as lines (uses first value if multi-value series)
- width (number) - Line width (default: 1)
- colors (color[]) - Color array for lines (theme-dependent)
- colorIndex (number) - Index to select specific color from colors array (optional)
- fill (boolean | 'momentum_fill' | 'default') - Fill area under line: false = no fill, true = solid fill, "momentum_fill" = conditional coloring based on positive/negative values with 4-color array [posLineColor, negLineColor, posFillColor, negFillColor], "default" = standard fill. Default: false
- smooth (boolean) - Enable smooth line rendering (default: true)
- showPriceDisplay (boolean) - Show current value in price scale (default: true)
- forceOnChart (boolean) - Force plot to appear on the main chart regardless of script position setting (default: false)
- label (string[]) - Labels for each data series. A label must be provided for each plot as required by the script editor.
- desc (string[]) - Descriptions for each data series. Optional but recommended - missing descriptions will generate warnings but will not prevent execution.
Returns:
void (plots line chart)
Visual Example:
Code Example:
plotShape - render custom shapes and markers on charts
plotShape(value: TimeSeries, shape: string, width?: number = 1, colors?: color[], colorIndex?: number, fill?: boolean | number = false, showPriceDisplay?: boolean = false, forceOnChart?: boolean = false, label?: string[], desc?: string[]): voidParameters:
- value (TimeSeries) - Data series for shape positioning (uses first value if multi-value series)
- shape (string) - Shape type to plot. Currently supported: 'circle' (circular marker/point). The shape parameter determines the visual marker style rendered at each data point.
- width (number) - Shape border width (default: 1)
- colors (color[]) - Color array for shapes (theme-dependent)
- colorIndex (number) - Index to select specific color from colors array (optional)
- fill (boolean | number) - Fill option for shapes: false = no fill (outline only), true = solid fill (opaque), number (0.0-1.0) = fill opacity/transparency (0.0 = transparent, 1.0 = opaque, 0.5 = 50% transparent). Default: false
- showPriceDisplay (boolean) - Show current value in price scale (default: false)
- forceOnChart (boolean) - Force plot to appear on the main chart regardless of script position setting (default: false)
- label (string[]) - Labels for each data series. A label must be provided for each plot as required by the script editor.
- desc (string[]) - Descriptions for each data series. Optional but recommended - missing descriptions will generate warnings but will not prevent execution.
Returns:
void (plots shapes on chart)
Visual Example:
Code Example:
plot - universal plotting function for all visualization types
plot(value: TimeSeries, plotType?: 'spline' | 'line' | 'bar' | 'candle' | 'point', width?: number = 1, colors?: color[], colorIndex?: number, fill?: boolean | 'momentum_fill', smooth?: boolean = true, showPriceDisplay?: boolean = true, forceOnChart?: boolean = false, label?: string[], desc?: string[]): voidParameters:
- value (TimeSeries) - The data series to visualize (candle type requires 4 OHLC values, others use first value if multi-value series)
- plotType (string) - "spline"/"line" for lines, "bar" for histogram, "candle" for OHLC, "point" for dots
- width (number) - Thickness of lines or size of bars/points (default: 1)
- colors (color[]) - Colors array - format depends on plot type and fill mode (theme-dependent)
- colorIndex (number) - Index to select specific color from colors array (optional)
- fill (boolean | 'momentum_fill') - Fill area: false = no fill, true = solid fill, "momentum_fill" = conditional coloring (requires 4-color array: [posLineColor, negLineColor, posFillColor, negFillColor])
- smooth (boolean) - Smooth line curves for better visual appeal (default: true)
- showPriceDisplay (boolean) - Show current value in price scale (default: true for main plot, false for nested)
- forceOnChart (boolean) - Force plot to appear on the main chart regardless of script position setting (default: false)
- label (string[]) - Labels for each data series. A label must be provided for each plot as required by the script editor.
- desc (string[]) - Descriptions for each data series. Optional but recommended - missing descriptions will generate warnings but will not prevent execution.
Returns:
void (plots data on chart)
Code Example:
hline - render horizontal reference lines on charts
hline(value: number, color?: string = 'gray', width?: number = 1): voidParameters:
- value (number) - Y-axis value where the horizontal line should be drawn
- color (string) - Line color (default: 'gray')
- width (number) - Line width (default: 1)
Returns:
void (plots horizontal line at specified value)
Visual Example:
Code Example:
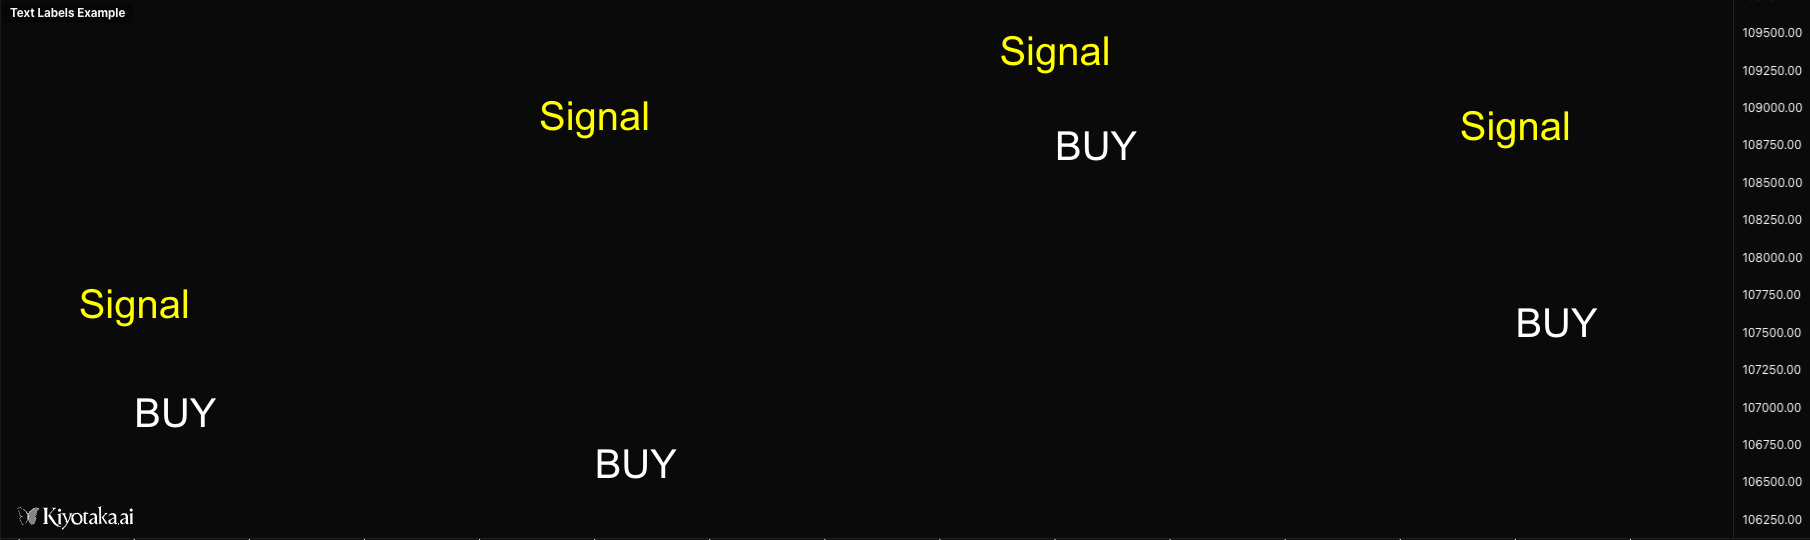
plotText - render text labels at specific price levels on charts
plotText(text: string, color: string, price: number, size?: number = 12, xAlign?: string = "CENTER", yAlign?: string = "CENTER", fill?: boolean = false, backgroundColor?: string = "transparent"): voidParameters:
- text (string) - The text content to display
- color (string) - Text color
- price (number) - Y-axis price level where the text should be positioned
- size (number) - Font size in pixels (default: 12)
- xAlign (string) - Horizontal alignment: "LEFT", "CENTER", or "RIGHT" (default: "CENTER")
- yAlign (string) - Vertical alignment: "TOP", "CENTER", or "BOTTOM" (default: "CENTER")
- fill (boolean) - Whether to add a background fill behind the text (default: false)
- backgroundColor (string) - Background color when fill is true (default: "transparent")
Returns:
void (renders text label at specified price level)
Visual Example:
Code Example:
plotLabel - render fixed-position text labels that do not move when panning or zooming
plotLabel(text: string, position?: string, x?: number, y?: number, color?: string = "#ffffff", size?: number = 12, xAlign?: string, yAlign?: string, fontFamily?: string = "Arial", backgroundColor?: string): voidParameters:
- text (string) - The text content to display
- position (string) - Predefined anchor position: "top_left", "top_center", "top_right", "middle_left", "middle_center", "middle_right", "bottom_left", "bottom_center", "bottom_right"
- x (number) - X pixel offset from position anchor (or absolute X if no position)
- y (number) - Y pixel offset from position anchor (or absolute Y if no position)
- color (string) - Text color (default: "#ffffff")
- size (number) - Font size in pixels (default: 12)
- xAlign (string) - Horizontal text alignment: "LEFT", "CENTER", or "RIGHT" (auto-set based on position)
- yAlign (string) - Vertical text alignment: "TOP", "CENTER", or "BOTTOM" (auto-set based on position)
- fontFamily (string) - Font family (default: "Arial")
- backgroundColor (string) - Background color behind the text
Returns:
void (renders fixed-position label on chart panel)
Code Example:
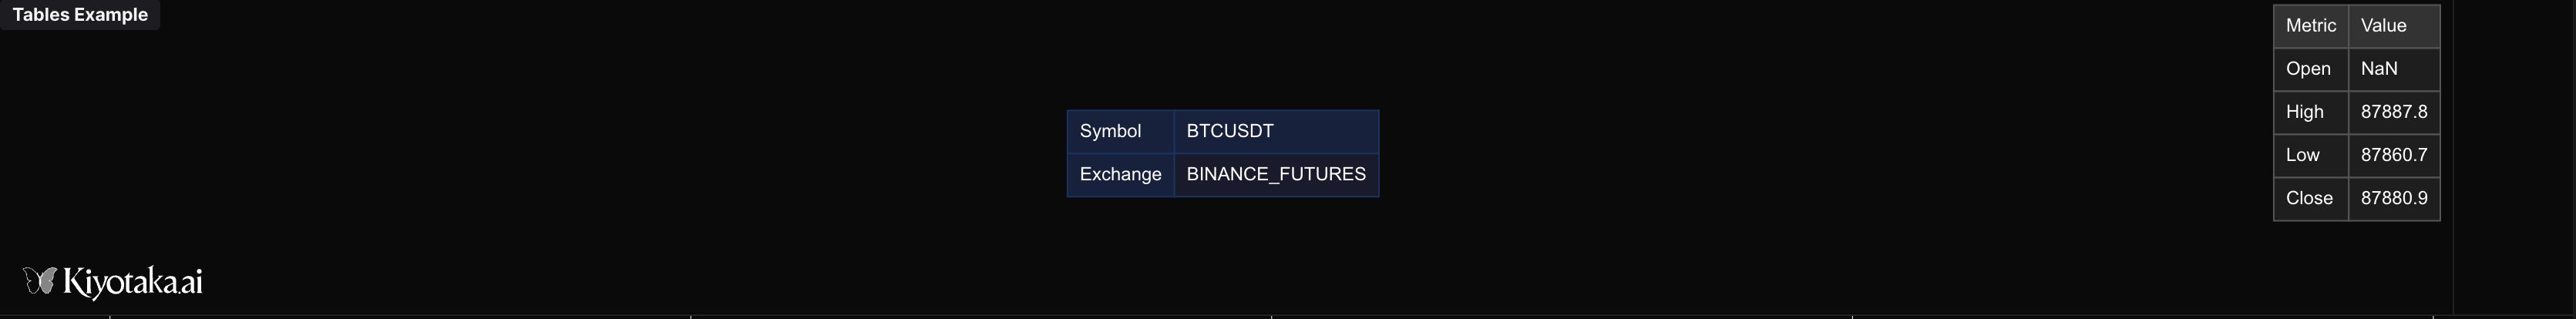
plotTable - render fixed-position tables that do not move when panning or zooming
plotTable(data: any[][], position?: string, x?: number, y?: number, headerRow?: boolean = true, headerColumn?: boolean = false, textColor?: string = "#ffffff", headerTextColor?: string = "#ffffff", backgroundColor?: string = "#1e1e1e", headerBackgroundColor?: string = "#333333", borderColor?: string = "#555555", borderWidth?: number = 1, fontSize?: number = 12, cellPadding?: number = 8, fontFamily?: string = "Arial"): voidParameters:
- data (any[][]) - 2D array of cell values. Each inner array represents a row.
- position (string) - Anchor position: "top_left", "top_center", "top_right", "middle_left", "middle_center", "middle_right", "bottom_left", "bottom_center", "bottom_right"
- x (number) - Horizontal pixel offset from anchor position
- y (number) - Vertical pixel offset from anchor position
- headerRow (boolean) - Style first row as header (default: true)
- headerColumn (boolean) - Style first column as header (default: false)
- textColor (string) - Default text color (default: "#ffffff")
- headerTextColor (string) - Header text color (default: "#ffffff")
- backgroundColor (string) - Cell background color (default: "#1e1e1e")
- headerBackgroundColor (string) - Header background color (default: "#333333")
- borderColor (string) - Border color (default: "#555555")
- borderWidth (number) - Border width in pixels (default: 1)
- fontSize (number) - Font size in pixels (default: 12)
- cellPadding (number) - Cell padding in pixels (default: 8)
- fontFamily (string) - Font family (default: "Arial")
Returns:
void (renders fixed-position table on chart panel)
Visual Example:
Code Example:
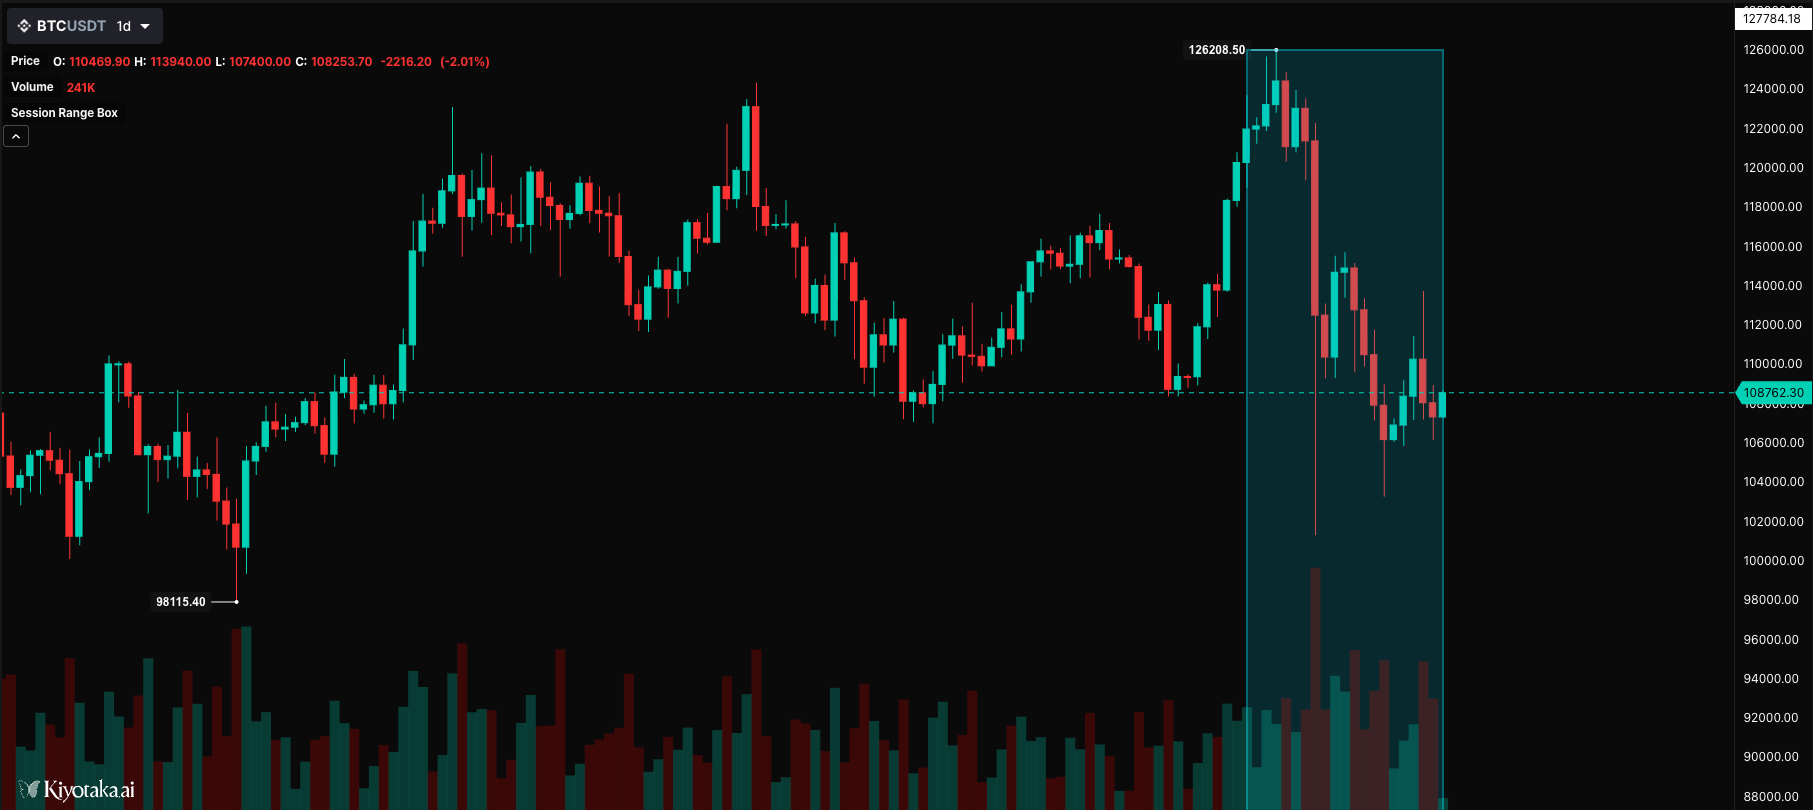
plotRange - render rectangular boxes between two time and price points
plotRange(time1: number, price1: number, time2: number, price2: number, color: string, fillColor: string): voidParameters:
- time1 (number) - Starting timestamp (left edge) in milliseconds
- price1 (number) - First price level (can be top or bottom)
- time2 (number) - Ending timestamp (right edge) in milliseconds
- price2 (number) - Second price level (can be top or bottom)
- color (string) - Border color of the rectangle
- fillColor (string) - Fill color of the rectangle (supports transparency)
Returns:
void (renders rectangular box on chart)
Visual Example:
Code Example:
plotBgColor - render background color for specific bars
plotBgColor(color: string, forceOnChart?: boolean): voidParameters:
- color (string) - Background color for the bar (supports rgba for transparency)
- forceOnChart (boolean) - Force background color to appear on main chart (default: false)
Returns:
void (renders background color on chart)
Visual Example:
Code Example:
Best Practices
Color Selection
Use contrasting colors for different data series. Consider color-blind accessibility when choosing color schemes for your indicators.
Line Width
Use thicker lines (3-4) for primary indicators and thinner lines (1-2) for secondary data. This creates visual hierarchy in your charts.
Smooth Curves
Enable smooth curves for continuous data like moving averages, but use straight lines for discrete signals or step functions.
Candlestick Colors
Use traditional green/red or green/red color schemes for candlesticks. Green typically represents bullish (closing higher) and red represents bearish (closing lower).
Shape Positioning
When using plotShape for signals, position markers slightly above or below price action to avoid overlapping with the main chart data.
Chart Types
Use plotCandle for price action analysis, plotBar for traditional OHLC display, plotLine for indicators, and plotShape for discrete signals and annotations.
Color Index Selection
Use the colorIndex parameter to programmatically select colors from your colors array. This is useful for dynamic color changes based on conditions or user inputs.