Script Definition
Functions for defining script metadata, input parameters, data sources, and output formatting. Essential foundations for creating well-structured and user-friendly kScript indicators.
Overview
Script Metadata
Define script properties including name, chart placement, axis configuration, and title customization for professional indicator presentation.
User Inputs
Create configurable parameters that users can adjust, including numbers, colors, booleans, and constrained selections for flexible indicators.
Data Management
Access market data sources, manage data feeds, and implement debugging tools for robust indicator development and troubleshooting.
Functions Reference
define - set script metadata and chart placement
define(title: string, position: 'onchart' | 'offchart', axis: boolean, customTitle?: string, format?: 'price' | 'abbreviated' | 'percentage'): voidParameters:
- title (string) - Display name of the indicator
- position ('onchart' | 'offchart') - Chart placement - 'onchart' or 'offchart'
- axis (boolean) - Show independent Y-axis for the indicator. When true, the format parameter can be used to control axis value formatting.
- customTitle (string) - Optional suffix appended to the title to display dynamic values (e.g., input parameters). Use variable interpolation like " ($period)" to show current settings in the chart title.
- format ('price' | 'abbreviated' | 'percentage') - Optional formatting style for axis values. "price" (default) shows raw values without abbreviation, "abbreviated" uses K/M/B notation (e.g., 10M for 10,000,000), "percentage" adds % symbol after the value. Only applies when axis=true.
Returns:
void (configures the script)
Code Example:
input - create user-configurable parameters
input(name: string, type: string, defaultValue?: any, label?: string, constraints?: any, options?: string[], group?: string): anyParameters:
- name (string) - Unique parameter identifier used internally
- type (string) - Input type: 'number' (numeric values), 'slider' (slider with draggable handle), 'boolean' (true/false), 'color' (hex color picker), 'color[]' (array of colors), 'string' (text values), 'text' (multi-line text), 'select' (dropdown selection), 'multiSelect' (multi-select dropdown with multiple selection)
- defaultValue (any) - Default value
- label (string) - User-friendly display name in settings panel
- constraints (object) - Validation rules for numeric inputs: {min: number, max: number, step?: number}. Limits the valid range and increment step of numeric inputs. Applicable for type="number" and type="slider". The step parameter defines the increment value (e.g., step: 5 allows values like 5, 10, 15...).
- options (string[]) - Array of choices for select and multiSelect types (required when type='select' or type='multiSelect')
- group (string) - Group name to organize related inputs into sections in the settings panel
Returns:
any (current parameter value set by user)
Visual Example:
Code Example:
source - create data source from market data
source(src: string, symbol: string, exchange: string): TimeSeriesParameters:
- src (string) - Data source type (e.g., 'ohlcv'). See
Data Sourcesfor all available types and aliases. - symbol (string) - Symbol for the data
- exchange (string) - Exchange for the data
Returns:
TimeSeries (source data series)
Code Example:
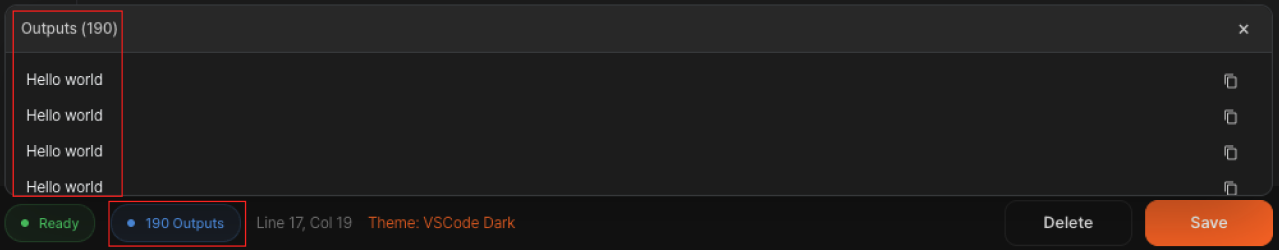
print - output debug information to console
print(message: any): voidParameters:
- message (any) - Value to output to console for debugging
Returns:
void (outputs to console)
Visual Example:
Code Example:
printTimeSeries - output time series data to console
printTimeSeries(source: TimeSeries, priceIndex?: number): voidParameters:
- source (TimeSeries) - Time series data to output
- priceIndex (number) - Index of price data to extract (optional)
Returns:
void (outputs time series data to console)
Code Example:
Best Practices
Naming Convention
Use descriptive names for scripts and inputs. Good names make your indicators more professional and user-friendly.
Chart Placement
Use 'onchart' for price-related indicators, 'offchart' for oscillators and volume indicators. Consider independent axes for different scales.