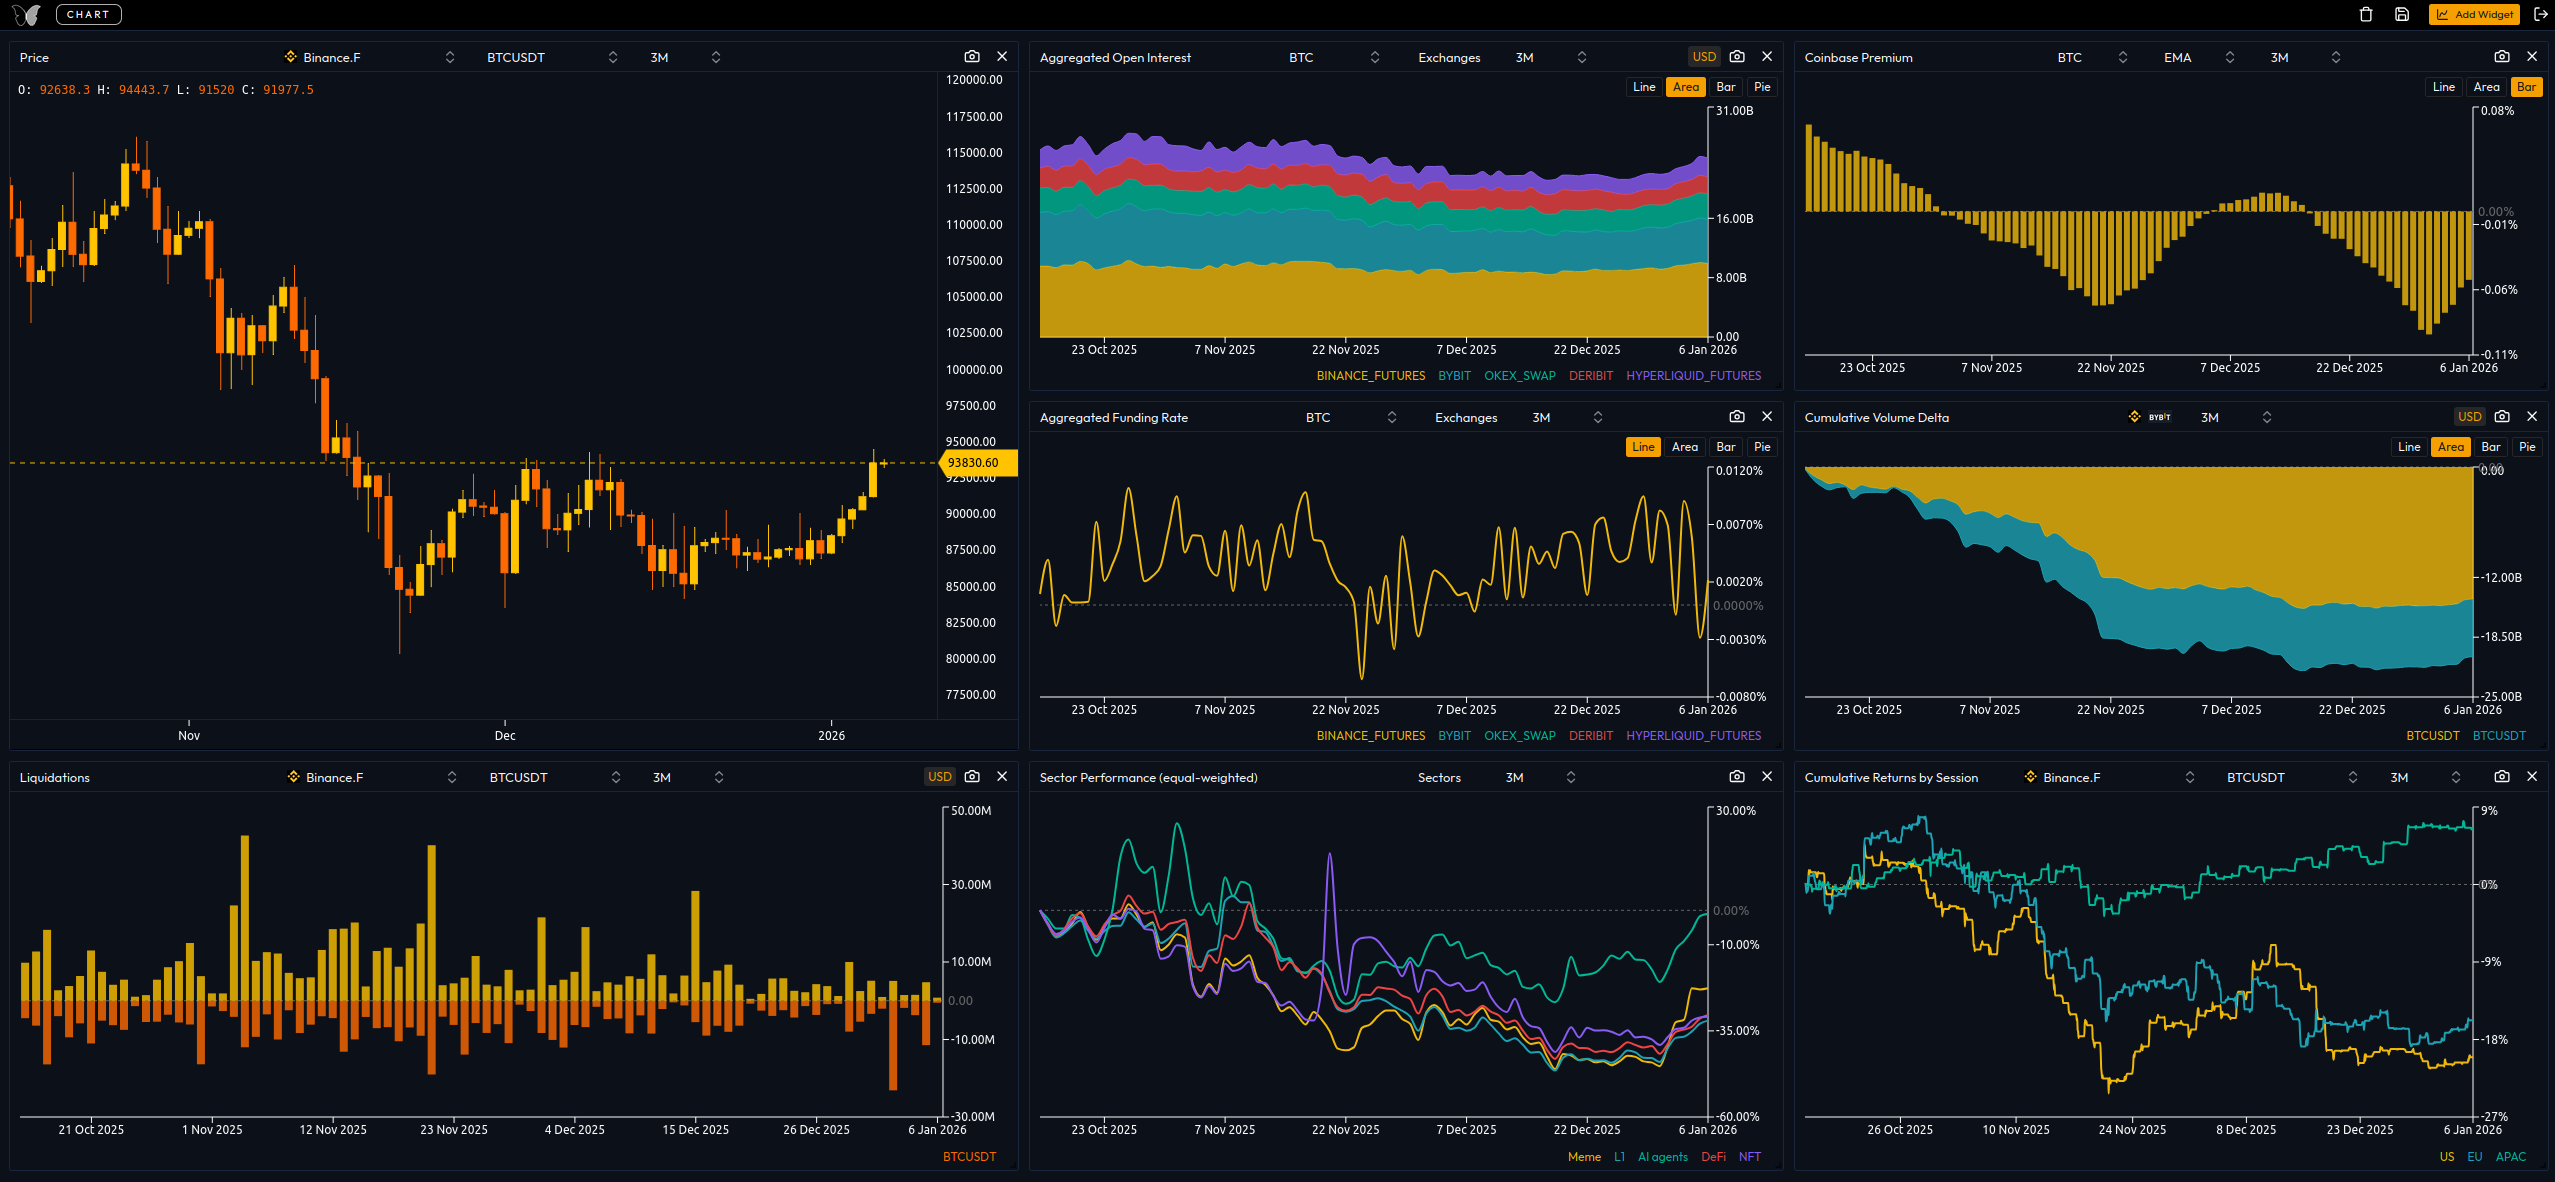
The Kiyotaka Dashboard serves as your personalized command center for high-level market analysis. By utilizing a flexible grid system, you can build a workspace that tracks the specific metrics, exchanges, and sectors that matter most to your trading strategy.
Key Features
Getting Started
To begin building your dashboard, click the Add Widget button located in the top right corner of the navigation bar. This will open the widget gallery, categorized by data type.
Available Widget Categories
The dashboard offers a wide variety of analytics tools divided into four primary categories:
General
Essential price and volume metrics for individual assets.
- Price & Volume: Standard OHLC and trading volume.
- Open Interest & Funding Rate: Monitor position positioning and cost of carry.
- Liquidations: Real-time tracking of forced position closures.
- CVD & Cumulative Returns: Analyze delta trends and session-specific performance.
Aggregated Metrics
Aggregated data across all supported exchanges to identify global market trends.
- Aggregated Volume & Open Interest
- Aggregated Funding Rate & Liquidations
Sector Performance
Track how specific niches (e.g., L1s, Memes, AI) are performing relative to the market.
- Equal-weighted & Mcap-weighted Performance
- Sector Volume, OI, and Funding Rates
Others
Specialized institutional and venue-specific data.
- Coinbase Premium: Tracking the spread between Coinbase and global exchanges.
- CME Open Interest: Institutional activity monitoring.
Customizing Your Widgets
Each widget is an independent module with its own configuration settings. To edit a widget, hover over the widget header to access the settings menu.
Configuration Options
| Feature | Description |
|---|---|
| Asset Selection | Switch between BTC, ETH, and hundreds of supported altcoins. |
| Exchange Source | Choose specific exchanges (e.g., Binance, Bybit) or use an "Aggregated" view. |
| Data Period | Adjust the lookback period (e.g., 24h, 7d, 30d) for the displayed metrics. |
| Display Styles | Toggle between line charts, bar charts, or area maps depending on the widget type. |
Sharing Insights
If you spot a significant market anomaly or a trend you want to highlight, you can use the Snapshot tool:
- Click the camera icon on the top right of any specific widget.
- The widget will be processed into a clean, high-resolution image.
- Save the image to your device for use in reports or social media posts.