The Order Book DOM (Depth of Market) is a high-performance execution and analysis tool that provides a vertical representation of market liquidity and real-time transaction flow. It combines limit order depth (passive liquidity) with executed trade flow (aggressive volume) to help you identify where the market is most likely to find support or resistance.
Core Functionality
Navigate market depth with precision using professional-grade controls.
- Symbol Management:
- Switch Symbols: Click the symbol name to manually search and switch to a different asset.
- Multi-Symbol Navigation: While each widget displays one coin, the search interface allows you to quickly pivot between up to 5 recently selected symbols.
- Sync State: Toggle the Link icon to sync the DOM with your main chart. When enabled, switching your chart's asset will instantly update the DOM widget to match.
- Depth Exploration:
- Deep Inspection: Scroll up or down to view bid and ask levels far from the current market price.
- Center View: Use the Center button to instantly snap the view back to the mid-price row, which highlights the current best bid price.
Column Breakdown
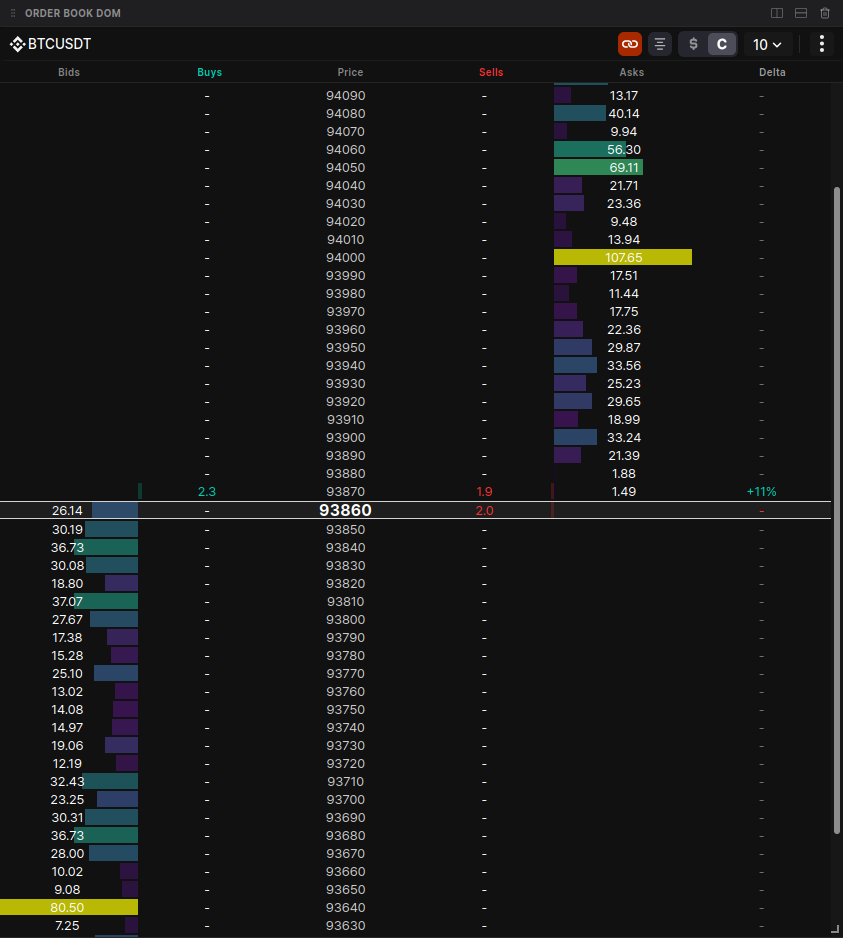
The DOM is organized into 6 specialized columns to provide total transparency into the auction process:
| Column | Name | Description |
|---|---|---|
| 1 | Bids | Shows limit order sizes for buy orders. Uses a color-coded heatmap where bar intensity reflects size relative to the maximum depth. |
| 2 | Buys | Cumulative counter of market buy trades (aggressive takers). Features a green background bar (20% opacity) extending left-to-right. |
| 3 | Price | The central axis. Decimal precision automatically adjusts based on your selected block size/grouping. |
| 4 | Sells | Cumulative counter of market sell trades. Features a red background bar (20% opacity) extending right-to-left. |
| 5 | Asks | Shows limit order sizes for sell orders. Like the Bids column, it uses heatmap intensity to visualize liquidity depth. |
| 6 | Delta | The net difference between buy and sell volumes shown as a percentage: (Buys - Sells) / (Buys + Sells) * 100%. |
Data & Display Customization
Units & Grouping
- Unit Toggling: Switch between Base Units (e.g., BTC) or Total Dollar Value (USD) to analyze liquidity in your preferred context.
- Dynamic Price Grouping: Adjust price precision to compress the book. Available grouping increments are dynamic and depend on the specific coin's price.
Themes & Sensitivity
- Themes: Choose from visual presets (e.g., Sunset, Ocean) to customize the color-coding of the heatmap and trade flow.
- Sensitivity: Adjust the sensitivity slider to change the intensity of the heatmap highlights, making significant "liquidity walls" stand out more clearly.